 Technologie, materiály CO2 RWE, E.ON and Vattenfall top the list of European CO2 emitters in 2008
RWE, E.ON and Vattenfall top the list of European CO2 emitters in 2008
Carbon Market Data, a European company providing carbon market research and data supply services, published the rankings of companies included in the European Union’s emissions trading scheme, following the recent release of verified emissions reports for the year 2008.
Based on Carbon Market Data’s research, RWE, E.ON and Vattenfall were the three biggest CO2 emitters of the EU emissions trading scheme (EU ETS) during the year 2008. RWE, E.ON and Vattenfall emitted in 2008 respectively 146 MtCO2, 108 MtCO2 and 85 MtCO2. These figures are calculated at a group level, taking into account both minority and majority stakeholdings in other companies included in the EU emissions trading scheme.
In the table below are shown for the year 2008 the distributed carbon allowances and emissions of these three companies.
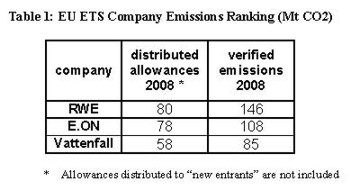
In 2007, the electricity generation capacity of the RWE Group amounted to 44.5 GW, of which 24.8 GW were fuelled with coal and lignite. These two factors - the massive power generation capacity of RWE coupled with a high dependence on coal and lignite – make of RWE by far the largest CO2 emitter in Europe. In January 2009, RWE bought the Dutch company Essent for 9.3 billion euros. The transaction will be effective in the third semester of 2009. Essent’s power plants emitted 8.3 MtCO2 in 2008.
The German energy company E.ON saw its CO2 emissions rise substantially between 2007 and 2008 (from 92 MtCO2 to 108 MtCO2), as it acquired during that time several energy companies outside Germany: Endesa Italia, Viesgo (Spain) and the SNET (France).
Last February, Vattenfall announced it will acquire the Dutch energy group Nuon for 8.5 billion euros. The transaction will be completed in several steps over the next six years. In 2008, Nuon’s power plants emitted a total of 12.6 MtCO2. The graph below shows for RWE the number of CO2 emissions versus the total number of free allowances received for each year under the EU emissions trading scheme. The figure displayed for the period 2005-08 represents the number of verified emissions; the red colour represents the shortage of EU allowances. The figure displayed for the period 2009-12 represents the number of allowances allocated for free.
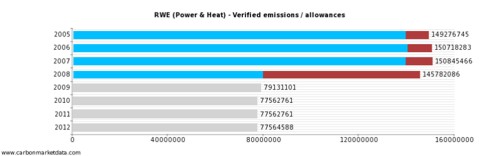
Figure 1 - RWE‘s CO2 emissions and allowances in the EU ETS
Companies with the highest carbon allowance surplus
In 2008, the three companies with the highest surplus of EU carbon allowances (EUAs) were three steel producers: ArcelorMittal (20.8 million EUAs surplus), Corus (7.5 million EUAs surplus) and ThyssenKrupp (5.6 million EUAs surplus). In 2007, the three companies with the highest surplus of EU carbon allowances were one steel producer, ArcelorMittal (19.5 million EUAs surplus), and two power and heat companies, Eesti Energia (4.8 million EUAs surplus) and Dalkia (4.6 million EUAs surplus).
This illustrates the fact that during the first phase of the scheme (2005-07), energy companies received large amounts of free carbon allowances. During the current phase (2008-12), power and heat companies, who face less international competition than the other sectors, were allocated far less free allowances.
To reinforce this trend, it can be noted that the ten companies experiencing the highest surplus of EU allowances in 2008 belong to the steel and cement sectors (eight steel producers and two cement companies), whereas in 2007 this ranking was composed of three steel producers, five power and heat producers and two oil and gas companies (the full list of these companies is included in our World ETS Database and can now be accessed online for free).
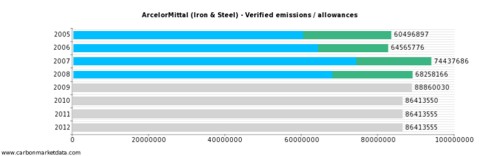
ArcelorMittal, the world‘s biggest steelmaker, had by far the largest surplus in EU carbon allowances in 2008. To a certain extent, this huge surplus of 20.8 million allowances can help the company to face the surge in power prices occurred since the start of the EU cap-and-trade scheme. At the current carbon price (13 €/tCO2), this EUA surplus represents potential trading revenues of 270 M€ per year (or 1.35 billion euros during the period 2008-2012).
Furthermore, with the current crisis hitting the steel sector forced to cut its production, ArcelorMittal should see in 2009 a record surplus in carbon allowances. Steel production in the European Union decreased by 48,6% in April this year compared with the same month a year before, according to the data published by the World Steel Association.
The graph below shows for ArcelorMittal the number of CO2 emissions versus the total number of free allowances received for each year under the EU emissions trading scheme. The figure displayed for the period 2005-08 represents the number of verified emissions; the green colour represents the surplus of EU allowances. The figure displayed for the period 2009-12 represents the number of allowances allocated for free.
Below is a graph showing the CO2 emissions and allowances of Corus, the Anglo-Dutch steelmaker recently acquired by the Indian company Tata Steel. The figure displayed for the period 2005-08 represents the number of verified emissions; the green colour represents the surplus of EU allowances. The figure displayed for the period 2009-12 represents the number of allowances allocated for free.
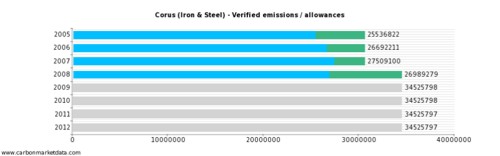
Figure 2 - Corus CO2 emissions and allowances in the EU ETS
Companies with the largest shortage of carbon allowances
Unsurprisingly, the three companies having in 2008 the highest shortage of EU carbon allowances are all involved in the electricity generation business, and are the biggest emitters of the scheme. These three companies are RWE (shortage of 66 Mt), E.ON (30Mt) and Vattenfall (28 Mt). Last year, these three companies were Enel (17 Mt), E.ON (10Mt) and Union Fenosa (10 Mt).
RWE had in the first phase (2005-07) of the scheme a shortage of about 10 million allowances per year, and now faces a much bigger shortage of allowances in the 2008-2012 period of the EU emissions trading scheme. In the 2008-2012 period, RWE plans to acquire in total about 90 million carbon credits from Clean Development Mechanism and Joint Implementation projects. The German energy company acquired last year a 50 per cent stake in carbon emission reduction project consultancy Agrinergy, based in Singapore.
Important note: New entrants’ data disclosure
Figures displayed in this press release do not include the EU allowances distributed for free to new entrants, as these data are not shown in the Community Independent Transaction Log (the EU carbon trading registry, also called CITL). A “new entrant” is defined in the EU directive establishing the carbon trading scheme as a new installation, or as an existing installation that has experienced a change of its activity “in the nature or functioning or extension of the installation”. As stated above, data on the number of EU carbon allowances distributed to these new entrants are not made available publicly in the EU carbon registry. Only the emissions reports of these installations are published.
About Carbon Market Data
Carbon Market Data is a carbon market research company and data vendor offering information, consulting and technology services to a wide range of organisations in the world. Carbon Market Data developed the EU ETS Companies Database, a unique and innovative carbon disclosure solution. The EU ETS Companies Database is a corporate carbon tracking tool that provides the following strategic information on more than 800 companies included in the EU emissions trading scheme:
CO2 verified emissions
Distributed allowances
Emissions-to-cap figures
List of installations
List of parent companies
List of subsidiaries
Sector of activity
Contact details
The EU ETS Companies Database is freely accessible online at http://www.carbonmarketdata.com .
Note for journalists:
All data and graphs shown in this document are available for free for publication by any newspaper, magazine and information provider (electronically or on paper). Please state the source of the data - Carbon Market Data - together with the website address http://www.carbonmarketdata.com next to the graphs used and within the article. For more information on Carbon Market Data, and our products and services, please contact: Cédric Bleuez, e-mail: cedric.bleuez@carbonmarketdata.com, Tel:
Autor
Související články
- Gazprom pokročil v jednáních o vstupu do RWE (18.7.2011)
- RWE Gas Storage zahájila práce na rozšíření zásobníku (26.5.2010)
Jakékoliv užití obsahu včetně převzetí, šíření či dalšího zpřístupňování článků a fotografií je bez souhlasu nakladatelství zakázáno.
Realizace: SE-MO Data s.r.o.